- Documented Access Control features (e.g., Device Approvals, Password Rotation, 2FA, Custom Login Pages).
- Added detailed descriptions for Logs & Analytics (Access Logs, Request Logs, Action Logs).
- Included configuration instructions and feature-specific notes for Pangolin Cloud and Enterprise Edition.

Signed-off-by: Stefan Mogeritsch <stefan.mo.co@gmail.com>
7.3 KiB
Documentation Index
Fetch the complete documentation index at: https://docs.pangolin.net/llms.txt Use this file to discover all available pages before exploring further.
Metrics
This is a basic example of collecting metrics from Traefik and CrowdSec using Prometheus and visualizing them with Grafana dashboards.
Important for users with low-powered server (1GB RAM): This setup will increase the use of your server RAM.Configuration
Traefik
For claiming metrics from Traefik we have to adjust some configuration files.
- Update the
docker-compose.ymlfile of the Pangolin stack to expose metrics port8082for the Prometheus connection:
service:
  gerbil:
    ports:
      - 8082:8082
- Update the
/config/traefik/traefik_config.ymlfile to include the following:
entryPoints:
  metrics:
    address: ":8082"

metrics:
  prometheus:
    buckets:
      - 0.1
      - 0.3
      - 1.2
      - 5.0
    entryPoint: metrics
    addEntryPointsLabels: true
    addRoutersLabels: true
    addServicesLabels: true
- Restart the Gerbil and Traefik container to apply the changes:
sudo docker restart traefik gerbil
Crowdsec
For claiming metrics from Crowdsec we have to adjust the docker compose files.
- Update the
docker-compose.ymlfile of the Pangolin stack to expose metrics port6060for the Prometheus connection:
service:
  crowdsec:
    ports:
      - 6060:6060
- Restart the Crowdsec container to apply the changes:
sudo docker restart crowdsec
Prometheus
- Create a new Prometheus container or add it to
docker-compose.ymlof Pangolin stack:
services:
  prometheus:
    container_name: prometheus
    image: prom/prometheus:latest
    restart: unless-stopped
    ports:
      - 9090:9090
    volumes:
      - /etc/timezone:/etc/timezone:ro
      - /etc/localtime:/etc/localtime:ro
      - ./config/prometheus/prometheus.yml:/etc/prometheus/prometheus.yml
      - ./config/prometheus/data:/prometheus
- Create a
prometheus.ymlfile in the/config/prometheusdirectory with the following content:
global:
  scrape_interval: 15s
  evaluation_interval: 15s

scrape_configs:
  - job_name: "prometheus"
    static_configs:
      - targets: ["localhost:9090"]

  - job_name: traefik
    static_configs:
      - targets: ["172.17.0.1:8082"]

  - job_name: crowdsec
    static_configs:
      - targets: ["172.17.0.1:6060"]
- Create a folder
datain/config/prometheusand change the owner and owning group:
chown nobody:nogroup data
- Start the Prometheus container:
sudo docker compose up -d
Grafana
- Create a new Grafana container or add it to
docker-compose.ymlof Pangolin stack:
services:
  grafana:
    image: grafana/grafana:latest
    container_name: grafana
    restart: unless-stopped
    ports:
      - 3000:3000
    volumes:
      - /etc/timezone:/etc/timezone:ro
      - /etc/localtime:/etc/localtime:ro
      - ./config/grafana/data:/var/lib/grafana
- Start the Grafana container:
sudo docker compose up -d
Add Prometheus Connection
Add the Prometheus connection under Connections -> Add new connection.
Set http://172.17.0.1:9090 as Prometheus Server URL and click Save & test.
Add Dashboard
Add a Dashboard under Dashboard -> New -> Import and import a pre configured Dashboard or create your own.
Traefik
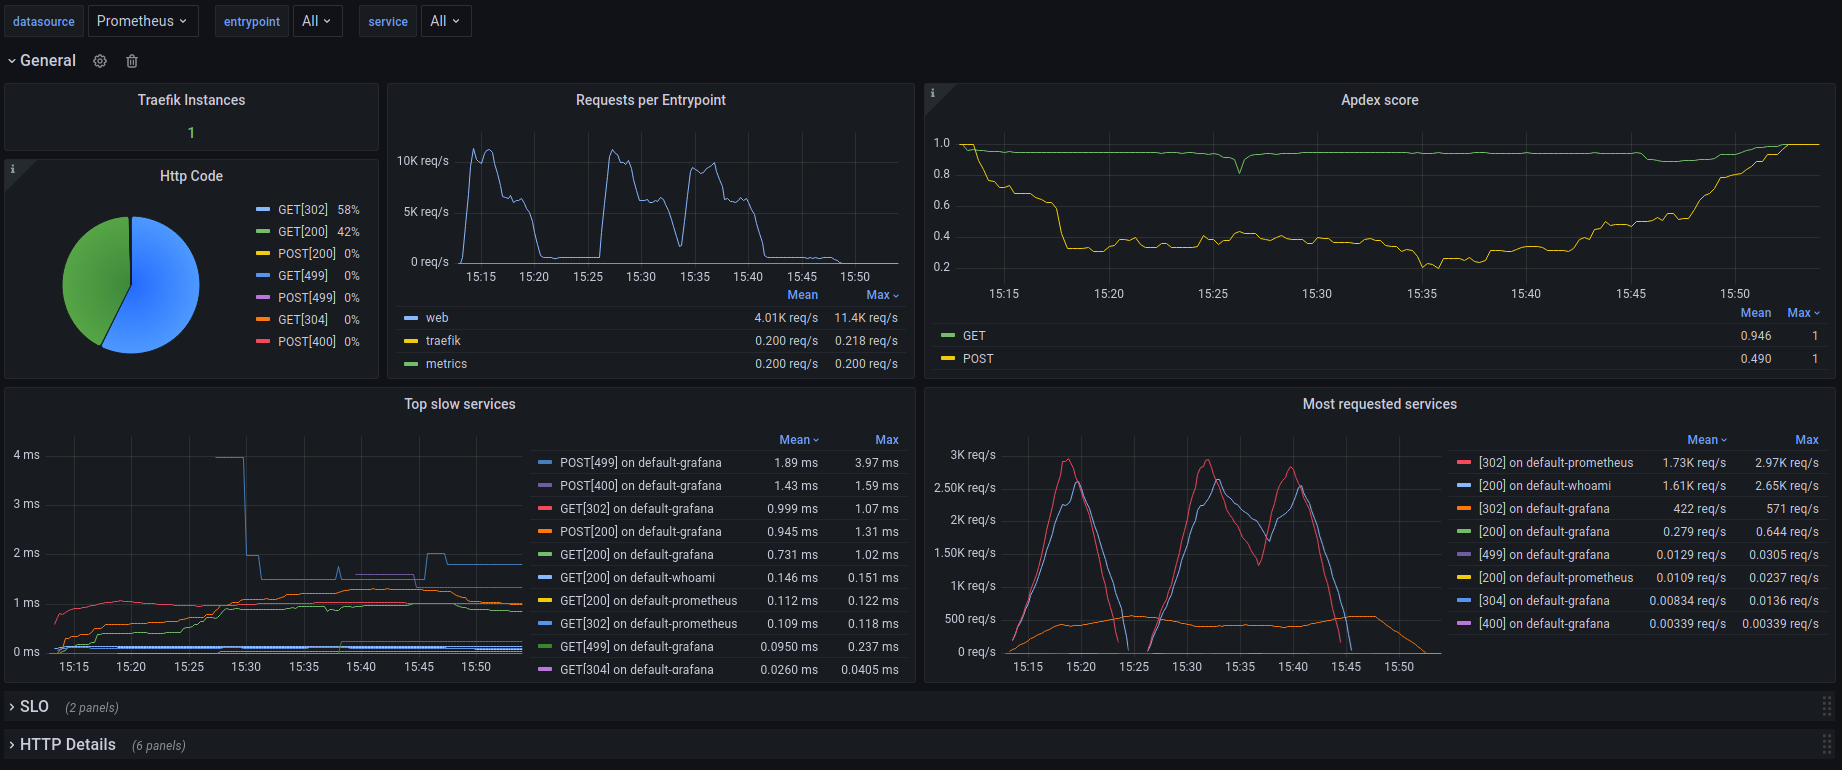
Template Import ID = 17346
https://grafana.com/grafana/dashboards/17346-traefik-official-standalone-dashboard/
Crowdsec
https://github.com/crowdsecurity/grafana-dashboards/tree/master